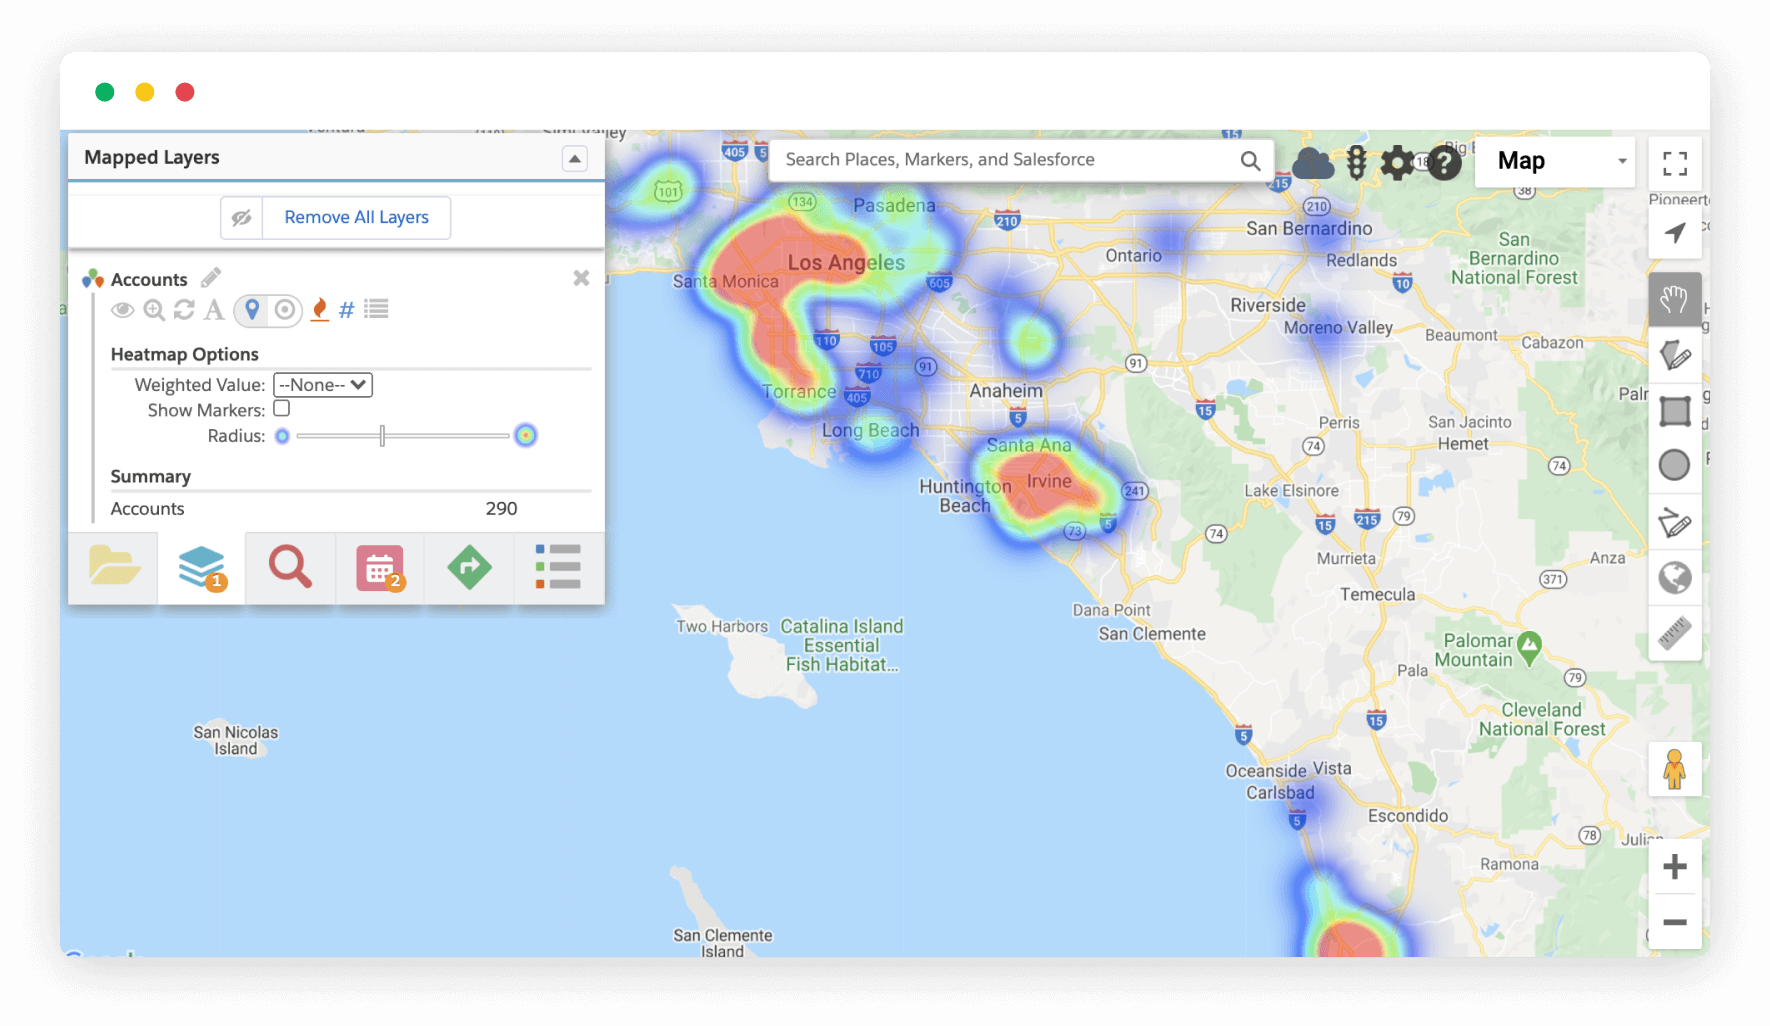
Imagine the time you would save if you didn’t have to go line-by-line through endless spreadsheets of data. Instead, you look at the map and in an instant understand where all your hundreds of accounts are, who your highest revenue-generators are, where your sales team should be focusing their time and attention, and so much more. Geopointe saves you hours of work by painting you a mental picture of the data that you used to keep in all those spreadsheets.
Your data and insights are right there in your CRM, you just can’t see them yet. Geopointe surfaces those insights with features like Heat Maps and Thematic Maps, providing you with a lens through which you can visualize your data.
Heat Maps display your data across the map with color-coded areas showing concentrations of records in an area. Unlike Heat Maps, Thematic Map layers allow you to see concentrations delineated by boundaries you set, not just hot spots. Both help to condense large amounts of data for quick understanding.
Data visualization drives insight, insight drives action, and effective action drives revenue. So the question is, can you afford not to put your data on a map?