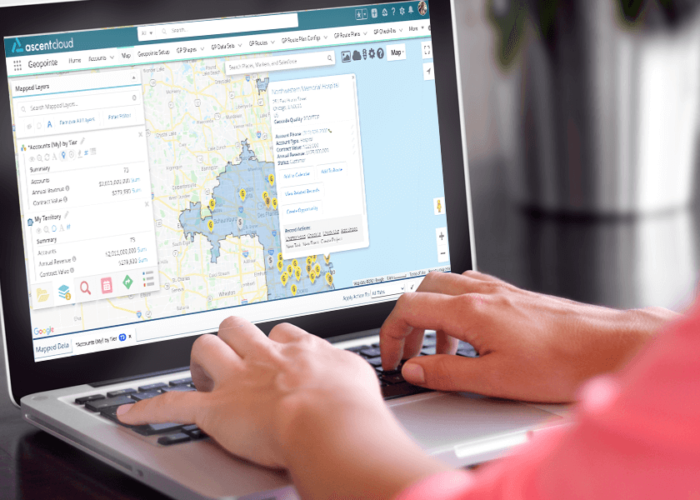
Key Geopointe Resources to Successfully Guide Your Executive Team
Executives need to see the big picture for new business ideas to come to light. In this blog, we’ll discuss some of the Geopointe features that Admins can setup to expand the dimensions of your executives’ Salesforce data and empower their decision-making.
 Report on Performance with Thematic Maps
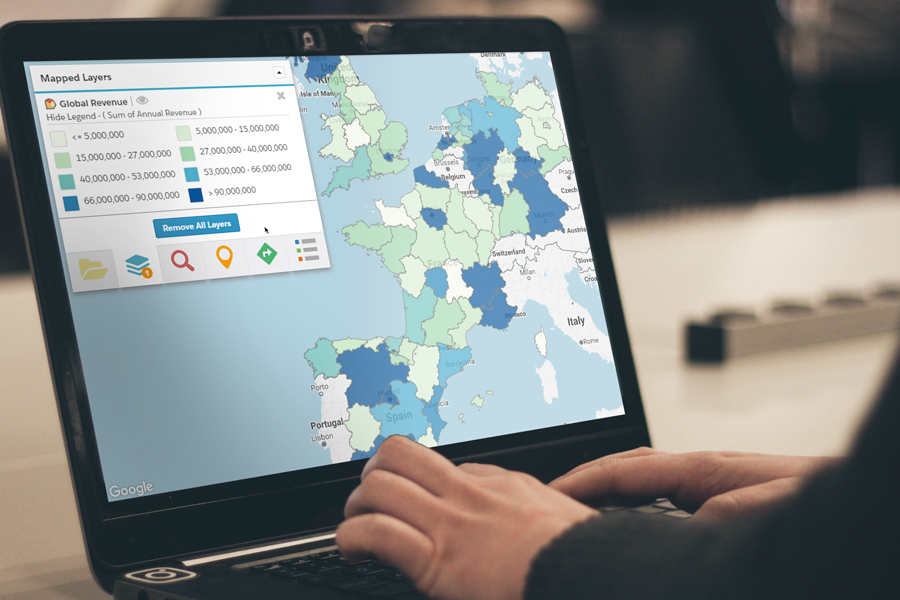
Thematic Maps can help executives draw big-picture conclusions and create impressive presentations. These map layers can calculate summaries of any numeric fields from a data set, like sum of opportunities, and roll up those stats for each of the shape boundaries of your choosing (e.g., states). Color coding makes these maps meaningful and easy to analyze at a glance.
For example, perhaps your executive end users want to show performance stats during a presentation for stockholders. They would configure the thematic layer by referencing an Accounts data set, then select to show a record count or a numerical field on that object, such as contract amount. Once the layer is loaded, they can use the roll-up summary to look closer at the numbers, providing tons of analytical power in a simple format.
 Manage Fleet Vehicles and Assets
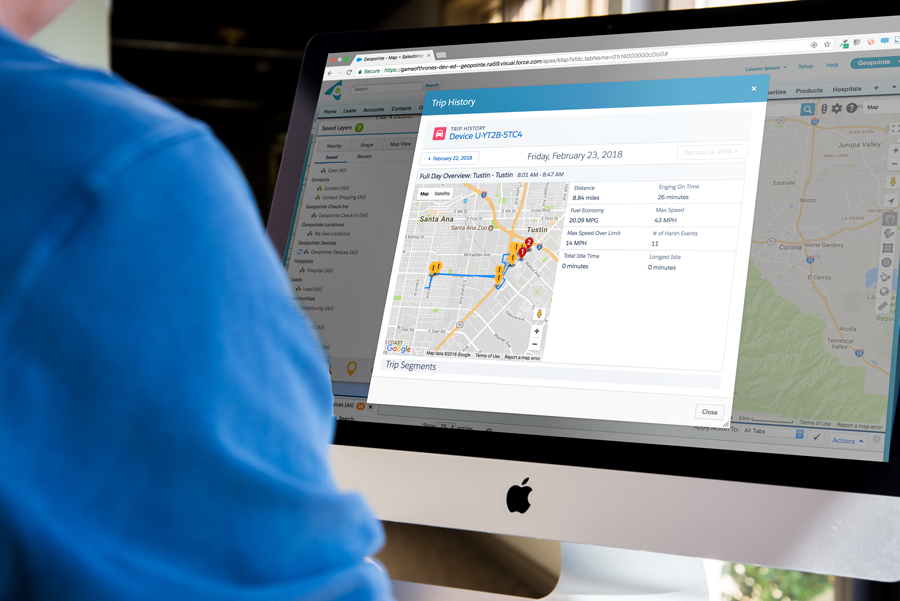
If your company operates fleet vehicles or other valuable assets in the field, keeping tabs on their locations is a top priority for executives. Geopointe’s Live Vehicle & Asset Tracking feature includes everything necessary to track your company’s assets in real time.
After installing the tracking devices on your vehicles, users will be able to see their real-time locations on the map. With a few clicks on each object, they can also see that vehicle’s trip history, fuel economy, max speed and other details. Daily vehicle summaries are available as a related list, making it easy for managers to keep an eye on their teams.
 See Your Salesforce Reports Geographically
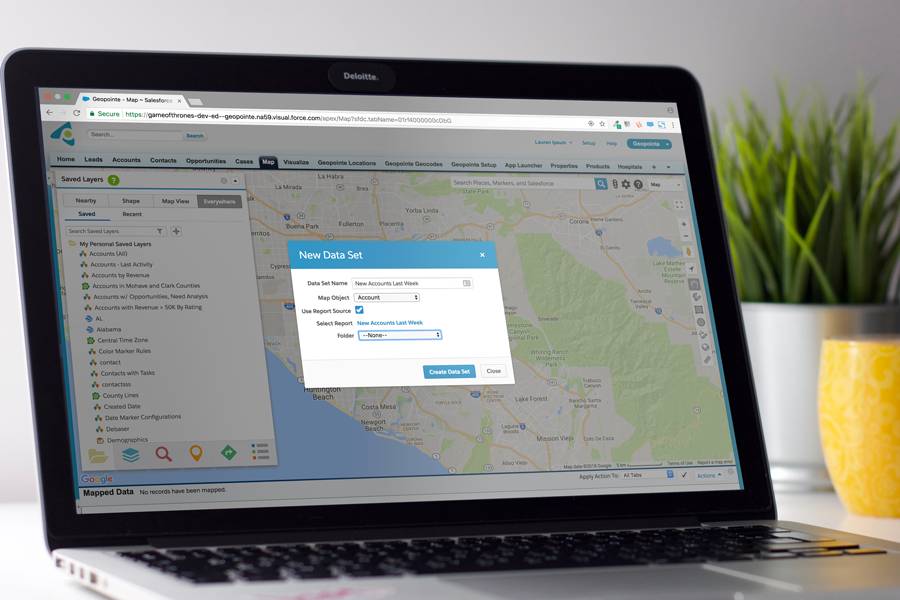
Salesforce reports are an essential tool for monitoring trends and keeping tabs on company performance. By referencing existing Salesforce reports for Geopointe data sets, executives can identify patterns and hot spots that they never saw before.
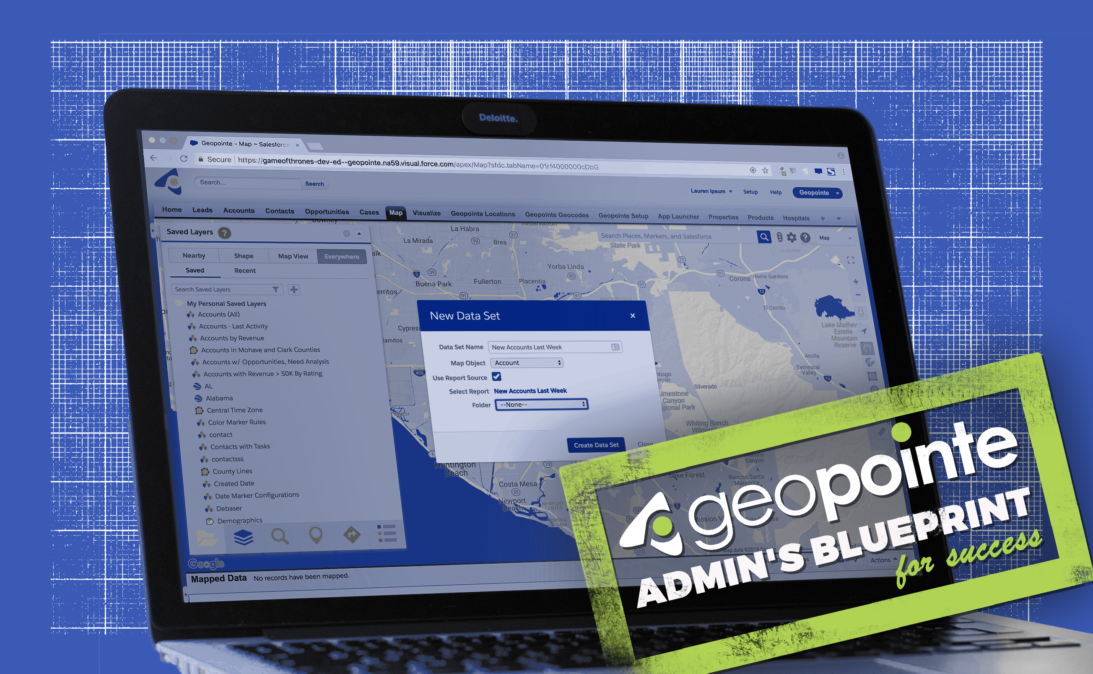
Perhaps your sales executives or managers run a daily or weekly report of Accounts by last activity date. They can duplicate this data set on the map by using the Report as Source option when creating an Accounts data set. The new data set will let them visualize account density geographically, so their team can identify target regions for new campaigns and outreach.
 Auto-Assign and Manage Records
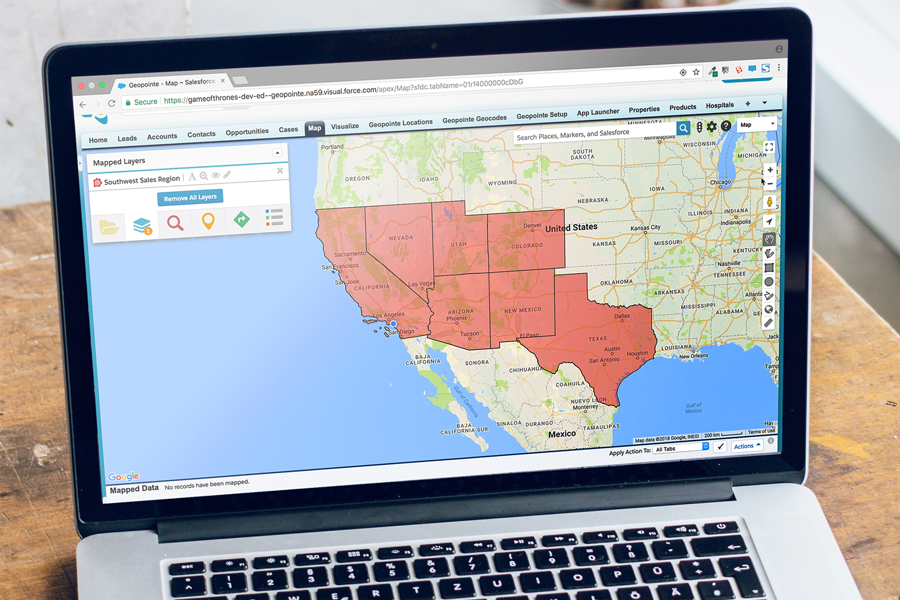
Assignment Plans can facilitate fundamental executive business processes, like assigning territories and complying with regional laws. The shape drawing tools in Geopointe make this process especially flexible and powerful. It can be used in countless ways, like defining the time zone where a record falls or designating no-service zones.
To define shapes where special regulations apply, managers can use shape tools to draw areas based on county, ZIP code or other boundaries. They can then create custom lookup fields to identify the regulation that applies, which will populate on any records that fall there. Assignment Plans use batch jobs, and will continuously look for address updates and keep assignments up to date.

